A high-visibility location is not a rent expense; it is a quantifiable, prepaid advertising asset that directly reduces your customer acquisition cost.
- Physical impressions (views of your storefront) can be assigned a monetary value comparable to digital ads, often at a lower “Physical CPM” (Cost Per Mille).
- Strategic elements like pylon signs, window graphics, and lighting are not aesthetic choices but tools to maximize the ROI of your real estate investment.
Recommendation: Stop viewing rent as a sunk cost. Instead, calculate its impression value and integrate it into your marketing budget as a perpetual top-of-funnel channel.
For any business owner scouting locations, the central conflict is always the same: the pristine, high-traffic corner spot versus the more affordable unit tucked away on a side street. Conventional wisdom dictates that “location is everything,” a platitude that feels hollow when faced with a lease demanding 20% more per month. The typical justification revolves around vague concepts like “brand awareness” or “foot traffic,” but these fail to provide the concrete, mathematical certainty needed to sign a check with confidence. Owners are forced to treat rent as a necessary evil—a fixed, unavoidable expense on the balance sheet.
This analysis rejects that premise. The true value of a high-visibility location is not abstract; it is a calculable marketing asset. The core error in most financial models is categorizing prime real estate solely as an operational expense. What if, instead, you treated that extra rent as a direct replacement for a portion of your digital advertising budget? The constant flow of traffic past your storefront generates thousands of daily impressions, a function identical to a perpetually running digital ad campaign. The key is learning how to quantify this value.
This guide provides a strategic framework for owners to deconstruct the ROI of physical presence. We will move beyond guesswork and into mathematical modeling, translating physical visibility into a direct ad spend equivalent. You will learn to calculate the “Physical CPM” of your location, optimize every visual element for maximum impact, and prove that a higher rent isn’t just an expense—it’s one of the most efficient marketing investments you can make.
This article will guide you through the strategic calculations and optimizations needed to turn your physical location into a powerful marketing engine. Below is a summary of the key areas we will dissect to build a robust ROI model for your business.
Summary: A Framework for Calculating Location ROI
- Is a Spot on the Shopping Center Pylon Worth an Extra $500 a Month?
- Window Graphics: How to Turn Glass into a 24/7 Salesperson?
- The 5-Second Rule: Can Drivers Identify Your Brand at 40 MPH?
- Hidden Gem: How to Use Wayfinding Signage if Your Location Is Tucked Away?
- Lighting Audit: Is Your Store Dark and Uninviting After 6 PM?
- How to Boost Local SEO Without Violating Corporate Identity Rules?
- Left-Turn Access: Why Being on the “Going Home” Side of the Road Matters?
- How to Plan a Grand Opening That Generates $10,000 in Day One Sales?
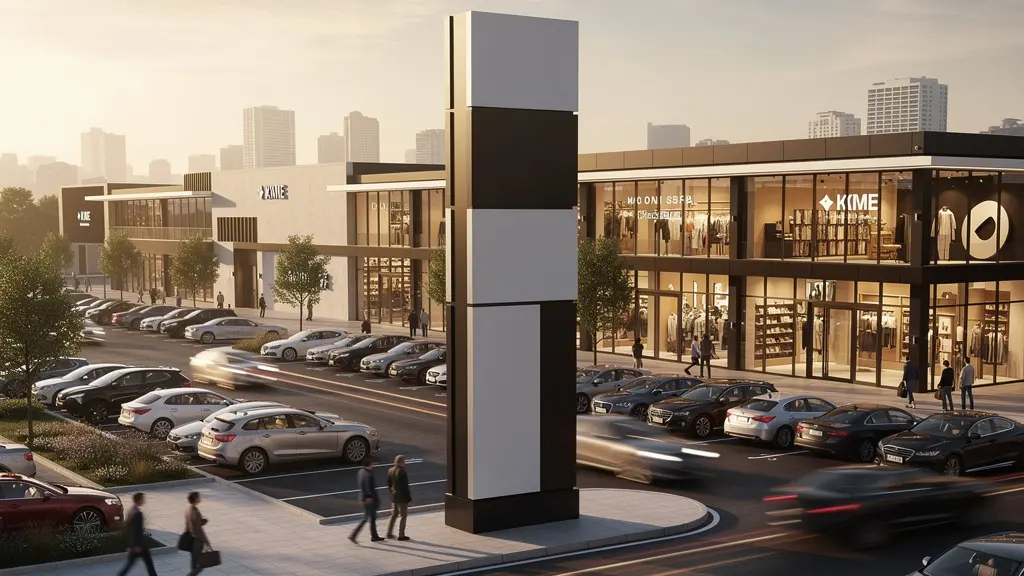
Is a Spot on the Shopping Center Pylon Worth an Extra $500 a Month?
A pylon sign is often the first financial hurdle in a high-visibility lease. To an accountant, an extra $500 per month is a $6,000 annual liability. To a marketing ROI analyst, it’s a media buy that needs to be compared against its digital equivalent. The key is to calculate the Physical Cost Per Mille (CPM)—the cost to generate 1,000 impressions—for that pylon spot. This metric transforms an abstract benefit into a number you can directly compare to the cost of Google or social media ads.
The calculation starts with data. Use local department of transportation data or Google Maps traffic estimates to determine the average daily vehicle count on the adjacent road. Not every driver will notice your sign, so we apply a visibility factor (typically 0.3 to 0.7) depending on the sign’s prominence and lack of clutter. For example, if 20,000 cars pass daily and your sign has a 0.5 visibility factor, you are generating 10,000 impressions per day, or 300,000 per month. At a cost of $500, your Physical CPM is approximately $1.67. This is significantly more efficient than many local digital display campaigns, which can run from $5 to $20 CPM.
Furthermore, this “ad” runs 24/7, unlike digital campaigns that are often time-gated to optimize budget. When you frame the cost this way, the pylon sign is no longer just a marker; it’s a remarkably efficient, always-on advertising channel. As a point of comparison, some research shows that digital advertising costs can mean paying $100 just to reach 1,000 voluntary viewers on a platform like YouTube. The pylon’s value becomes immediately apparent.
To make this calculation tangible for your specific opportunity, follow a structured framework. By quantifying impressions and comparing them to established digital advertising benchmarks, you can build an undeniable business case for the investment.
- Measure Baseline Traffic: Use Google Maps traffic data or local DOT reports to establish the daily vehicle count during peak and off-peak hours.
- Calculate Impressions: Multiply the daily traffic count by a conservative visibility factor (e.g., 0.4) to estimate daily sign impressions.
- Compare to Digital CPM: Research local CPM rates for digital display ads in your industry (benchmarks are often $5-$20).
- Factor in 24/7 Advantage: Acknowledge the pylon’s constant visibility versus the often-limited runtime of a paid digital campaign.
- Apply the ROI Formula: (Monthly Impressions × Local Digital CPM Rate / 1000) – Monthly Pylon Cost = Net Value. A positive number indicates the pylon is a more efficient investment.
Window Graphics: How to Turn Glass into a 24/7 Salesperson?
If the pylon sign is your top-of-funnel billboard, your storefront windows are your mid-funnel landing page. They have one critical job: convert a passerby’s fleeting glance into active interest or, ideally, a physical entry. Generic “Sale” signs or cluttered displays fail this task. A strategic window graphic, however, works as a silent, 24/7 salesperson, communicating your brand promise and value proposition without a single human interaction.
The first principle is to move beyond mere information and create intrigue. Instead of listing services, use bold, abstract graphics, compelling lifestyle photography, or a single, powerful question that resonates with your target customer. This transforms your glass from a simple barrier into a storytelling canvas. The goal is to make someone pause and think, breaking them out of their autopilot commute. This moment of engagement is a micro-conversion.
To take this further, modern window graphics can bridge the physical-digital divide. Integrating a well-designed QR code that links to an exclusive offer, a video demonstration, or a virtual “try-on” experience turns a passive viewer into an active lead. You are no longer just advertising; you are initiating a conversation and capturing data, even when your store is closed.
This approach transforms your window into a high-performing asset. It filters foot traffic, ensuring that those who enter are already pre-qualified and interested in your brand’s story. It is a direct driver of higher-quality traffic and improved in-store conversion rates.
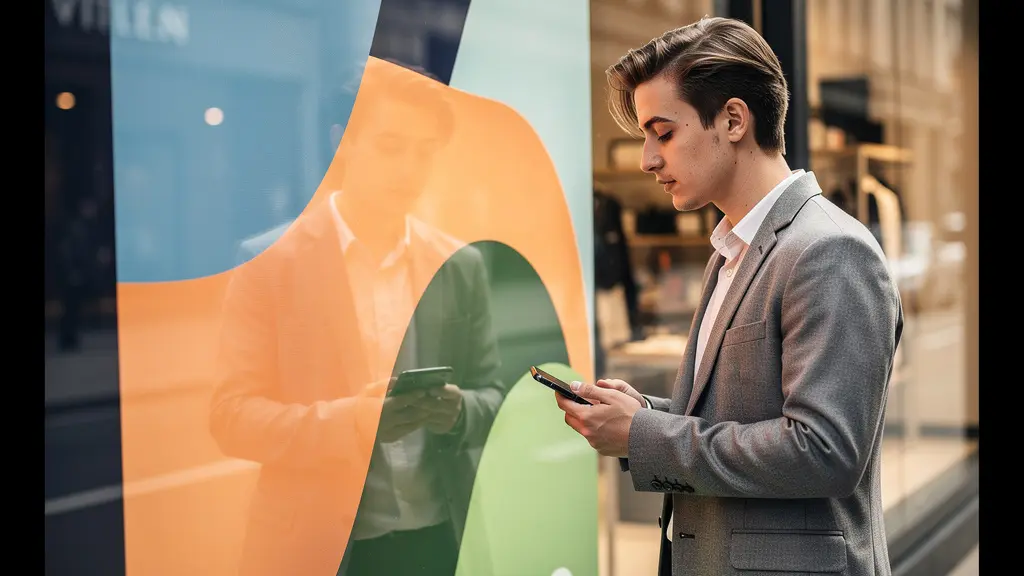
As the image suggests, the power lies in engagement. The customer is not just looking; they are interacting. This is the difference between a static ad and a dynamic sales tool. By making your storefront a point of interaction, you extend its value far beyond simple brand visibility.
Case Study: IHOP’s Integrated Visibility Strategy
A prime example of blending physical and digital visibility comes from IHOP. By combining YouTube’s location-targeted ads with strong physical storefront presence, including effective window displays, the company was able to drive store visits for less than $1 per guest. This campaign demonstrated a crucial feedback loop: digital ads created the initial awareness, and the physical storefront (the “24/7 salesperson”) served as the immediate, low-friction conversion point for that digitally-generated interest.
The 5-Second Rule: Can Drivers Identify Your Brand at 40 MPH?
For locations on busy thoroughfares, you don’t have minutes to make an impression; you have seconds. The “5-Second Rule” is a critical test for any street-facing brand: can a driver, traveling at 40 MPH (approx. 60 km/h), not only see your business but also understand what you do in the time it takes to pass by? If the answer is no, a significant portion of your visibility investment is being wasted. This is a test of cognitive load—how much mental effort is required to process your brand’s message.
Effective high-speed branding relies on three pillars: simplicity, color, and iconography. Your primary signage should feature a maximum of 3-5 words, in a large, clean, high-contrast font. Small, intricate logos or lengthy taglines become an indecipherable blur at speed. The goal is legibility from a distance, not detailed information. This is about planting a seed of recognition that can be acted upon later.
Color is your most powerful tool for instant recognition. Brands like T-Mobile (magenta), McDonald’s (red and yellow), and UPS (brown) have mastered this. They are identifiable by their color palette alone, long before their name is readable. Your brand’s primary color should be used boldly and consistently across all exterior signage to create a distinct visual anchor that cuts through environmental noise. The final piece is a single, iconic visual element that communicates your business category without text. A stylized coffee cup, a book, a wrench—this simple icon tells a story faster than any word can. When a consumer sees this visual cue, it can trigger action, just as research on visual marketing impact shows that 87% of consumers took an action after seeing a brand’s video ad.
To audit your own visibility, use the “squint test”: stand across the street, squint your eyes to blur your vision, and see what remains. Is your color signature still visible? Is your primary shape or logo still distinct? If all you see is a generic box, your brand is failing the 5-Second Rule.
Your High-Speed Visibility Audit Checklist
- Conduct a Virtual Drive-By: Use Google Street View to “drive” past your location from all directions and at different simulated times of day. Is your signage clear and unobstructed?
- Perform the Squint Test: From a distance of at least 200 feet, squint to blur your vision. Does a distinctive color or shape remain, or does your storefront blend into the background?
- Assess Color Coding: Is your primary brand color used consistently and boldly enough to act as a unique identifier, like T-Mobile’s magenta?
- Evaluate Your Iconography: Do you have a single, strong visual element that communicates what your business does without relying on text?
- Measure Cognitive Load: Ask someone unfamiliar with your business to glance at a photo of your storefront for 3-5 seconds. Can they accurately describe what you sell or do?
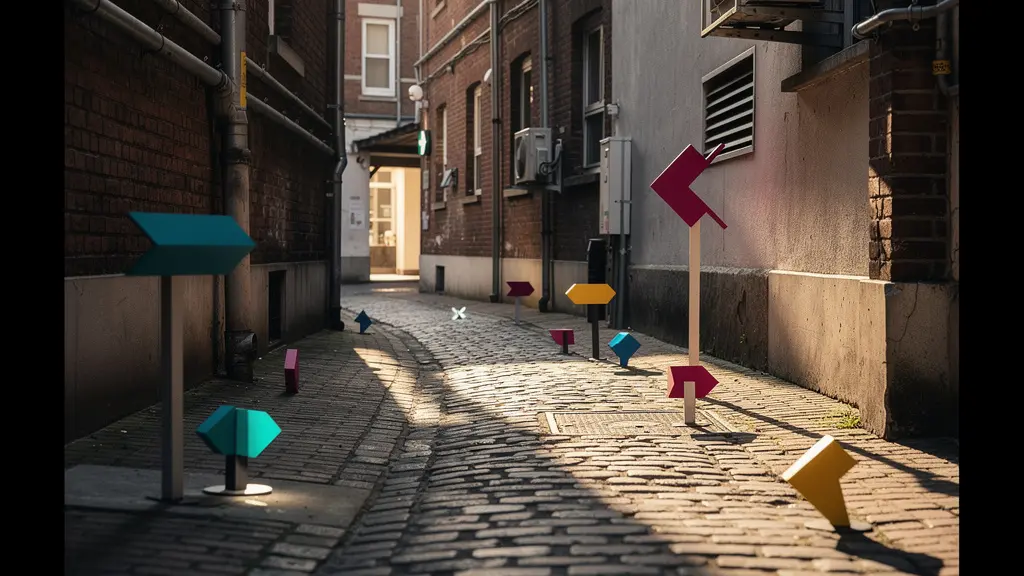
Hidden Gem: How to Use Wayfinding Signage if Your Location Is Tucked Away?
Not every great business can secure a spot on the main drag. Sometimes, the perfect location is tucked into a courtyard, down an alley, or on the second floor. In these cases, the marketing challenge shifts from maximizing passive visibility to creating an active, guided journey. This is where strategic wayfinding becomes a powerful marketing tool, transforming a potential disadvantage into a unique and memorable brand experience.
Generic, utility-style “This Way” signs are a missed opportunity. Instead, think of wayfinding as a “breadcrumb trail” that builds anticipation and reinforces your brand at every step. This begins the moment a customer might get lost. Place your first sign not at your door, but at the main street corner where they need to make a turn. This sign shouldn’t just be an arrow; it should be an extension of your brand identity, using your colors, font, and a touch of personality.
The journey itself can become part of the appeal. A series of smaller, artistically designed markers can lead customers on a path of discovery. For a bookstore, this could be literary quotes on the pavement. For a cafe, it might be a trail of stylized coffee bean graphics. This approach does more than provide direction; it creates a sense of being an “insider” who has discovered a hidden gem. By the time customers arrive, they have already engaged with your brand multiple times and feel a sense of accomplishment, making them more likely to convert and share their discovery with others.
This creative approach to wayfinding is an investment in customer experience. It shows a high level of care and attention to detail, which customers will assume extends to your products or services. It turns the problem of a hidden location into a narrative of exploration and reward, creating a far more powerful connection than a simple storefront ever could.
Lighting Audit: Is Your Store Dark and Uninviting After 6 PM?
A significant portion of your rent pays for 24/7 visibility, yet many businesses effectively “close” their most valuable marketing asset after hours by going dark. An unlit or poorly lit storefront from 6 PM to 6 AM is a massive waste of potential impressions. A strategic after-hours lighting audit is crucial to maximizing the ROI of your physical location, turning your store into a silent, glowing billboard that works while you sleep.
The analysis begins by segmenting lighting into three categories: security, architectural, and brand. Basic security lighting is purely functional, casting harsh, uneven light that often makes a location look closed and uninviting. While necessary, it provides minimal brand impact. The next level, architectural accent lighting, uses uplighting, wall washes, and spotlights to highlight the building’s features. This creates a more premium, sophisticated perception and makes the location feel safe and professional.
The ultimate goal, however, is a full brand ambience package. This involves using light to reinforce your brand identity. It could mean a wash of your signature brand color across the facade, a creatively lit window display that tells a story, or a glowing, high-quality sign that serves as a beacon. This level of investment turns your storefront into a landmark, generating high-quality brand impressions throughout the night and early morning from commuters, local residents, and evening foot traffic.
The ROI can be calculated by comparing the monthly cost of a strategic lighting package against the value of the impressions it generates. A well-lit store in a high-traffic area can generate tens of thousands of additional impressions per month, an equivalent value that can far exceed the electricity and fixture costs.
This table breaks down the investment versus the return, demonstrating how a strategic approach to lighting directly translates into marketing value.
| Lighting Type | Monthly Cost | Hours of Visibility | Impression Value |
|---|---|---|---|
| Basic Security Lighting | $50-100 | 12 hours (6pm-6am) | Minimal brand impact |
| Architectural Accent Lighting | $150-250 | 12 hours | Creates premium perception |
| Full Brand Ambience Package | $300-500 | 24/7 enhancement | Equivalent to $2000+ in digital impressions |
How to Boost Local SEO Without Violating Corporate Identity Rules?
For franchisees or businesses with strict corporate branding guidelines, localizing digital marketing can feel like walking a tightrope. However, your physical location is your most powerful—and brand-compliant—asset for dominating local search results. The key is to leverage your physical presence to create authentic local signals that search engines love, without altering a single brand color or logo. In fact, local SEO statistics reveal that over 80% of consumers perform an online search before visiting a local business for the first time, making this digital-physical link essential.
Your first and most important tool is your Google Business Profile (GBP). This is your digital storefront. While the logo and branding are corporate-controlled, the content can be hyper-local. Your strategy should include:
- Location-Specific Photos: Regularly upload high-quality photos of your *actual* store, your team members, and products in your specific environment. This provides authentic, local visual content that generic corporate stock photos cannot.
- Google Business Profile Q&A: Proactively populate the Q&A section. Ask and answer common local questions (e.g., “Where is the best place to park near your downtown location?”), using corporate-approved language in your answers. This captures local search intent.
- Local Content Creation: Create content on your local landing page about community events you’re involved in, local partnerships, or feature a “local team member of the month.” This content is unique to your location and signals deep community relevance to Google.
Furthermore, your physical location is a backlink-generating machine. Partner with non-competing local businesses for cross-promotions. Join the local chamber of commerce or a business improvement association, many of which will link back to your website from their high-authority local directory. These actions build a portfolio of brand-safe, locally relevant backlinks that are impossible for a national-level strategy to replicate. Finally, encourage customer reviews and respond to them using the approved brand voice. Each review is a fresh piece of user-generated local content that reinforces your relevance for “near me” searches.
Left-Turn Access: Why Being on the “Going Home” Side of the Road Matters?
Advanced location analysis moves beyond simple visibility to scrutinize the quality and nature of the traffic. A crucial, often-overlooked variable is “left-turn friction.” Being on the right side of the road for the dominant traffic flow—typically the “going home” side during the evening commute—can dramatically increase your accessible customer pool. Why? Because a simple right turn is a low-friction action, while a left turn across multiple lanes of oncoming traffic is a high-friction barrier that many drivers will actively avoid.
Imagine two identical coffee shops on opposite sides of a major commuter route. The shop on the right side of the road for evening traffic captures customers with a simple, impulsive turn into the parking lot. The shop on the left, however, requires a driver to wait for a gap in traffic, potentially through multiple light cycles, transforming an impulse buy into a logistical chore. The “cost” in time and frustration is too high, and the sale is lost, even if the store’s visibility is perfect.
Analyzing this requires more than just counting cars; it demands a study of traffic patterns. Modern tools make this accessible to any business owner. You can use the traffic layer on Google Maps during peak commute hours (e.g., 5-7 PM on weekdays) to visualize traffic density and flow. A road that is deep red in one direction and green in the other provides a clear, data-backed insight into which side of the street holds the low-friction advantage.

This microscopic view of traffic flow reveals the invisible forces that direct consumer behavior. The visual difference between the ease of a right turn and the complexity of a left turn becomes starkly apparent from this perspective. It’s a variable that can justify a significant rent premium.
Case Study: Using Traffic Data to Validate Location
Leading retail consultants now routinely use traffic pattern analysis to validate location decisions. By leveraging readily available tools like Google Maps, they can identify which side of the road captures the highest volume of “going home” commuter traffic. This data-driven analysis provides a solid, quantifiable argument to justify paying a higher rent for a position on the low-friction side of the road, as it directly translates to a larger and more accessible customer base during peak purchasing hours.
Key Takeaways
- Treat high-visibility rent as a marketing investment, not just an operational cost, by calculating its “Physical CPM.”
- Every visual element—from pylon signs to window graphics and after-hours lighting—is an asset to be optimized for maximum ROI.
- The value of a location depends not just on visibility, but on nuanced factors like brand legibility at speed and low-friction access for target traffic.
How to Plan a Grand Opening That Generates $10,000 in Day One Sales?
A grand opening is your single best opportunity to convert the potential energy of a new, high-visibility location into an explosive wave of kinetic energy: sales, leads, and community buzz. A target of $10,000 in first-day sales is not about luck; it’s about a meticulously executed plan that leverages your new visibility to its absolute maximum. The event itself is the final step in a multi-week launch sequence.
The campaign should begin 2-3 weeks pre-launch. Use your highly visible (but not yet open) storefront as a backdrop for teaser content. Create short videos for social media showing “behind-the-scenes” progress, building anticipation. The night before the public opening, host an exclusive VIP preview event for local business owners, community leaders, and micro-influencers. This generates early social proof and word-of-mouth marketing from trusted local voices.
On the day of the opening, your goal is to be unmissable. Amplify your already-great visibility with temporary, high-impact elements: balloons, spotlights, live music, and even more signage. Your location should feel like the epicenter of activity in the area. Most critically, you must have a lead capture mechanism. A simple prize draw for a high-value prize (like “win free products for a year”) in exchange for an email address or phone number is a powerful way to build your customer database from day one. This turns one-day visitors into long-term marketing leads.
Finally, document everything. Have a dedicated person filming the crowds, the interactions, and the excitement. This footage becomes a goldmine of marketing content for months to come, providing powerful social proof for your website and social media. The value of this content cannot be overstated, especially when video marketing statistics show that 70% of viewers have made a purchase after seeing a brand on YouTube. Your grand opening video can become a top-performing ad.
Ultimately, the decision to invest in a high-visibility location is a strategic one that should be made with a calculator, not just a gut feeling. By deconstructing the value of physical impressions and optimizing every visual touchpoint, you transform a monthly rent payment from a liability into your most efficient and reliable customer acquisition channel. Start by calculating the true ROI of your location today.