
The key to cutting food cost variance by 2% isn’t in your recipes, but in optimizing the hidden logistics between your vendors and your storeroom.
- Systematic receiving protocols can eliminate errors that cost the average unit over $500 monthly.
- Aligning order frequency with cash flow—not just inventory levels—is critical for financial health.
Recommendation: Start by calculating your Total Cost of Ownership (TCO) for every supply chain tool and process, not just the sticker price.
For restaurant and retail owners, the gap between theoretical and actual food cost is a constant source of margin erosion. This food cost variance, often accepted as a simple cost of doing business, represents a significant and recoverable profit leak. Most advice centers on familiar territory: standardizing recipes, portion control, and minimizing kitchen waste. While these are necessary components of cost control, they only address the final stage of the inventory journey. They fail to scrutinize the systemic inefficiencies that occur long before an ingredient ever reaches the prep line.
The real, untapped opportunity for margin recovery lies not in the kitchen, but within the complex mechanics of your supply chain. This is where large corporate chains find their edge—by applying rigorous logistical and mathematical principles to every step, from procurement to receiving. They understand that variance is not just about waste, but about the cumulative cost of operational friction: an incorrect delivery, a suboptimal ordering cycle, a missed opportunity on a master agreement. These are not random accidents; they are predictable outcomes of a non-optimized system.
This guide departs from conventional wisdom. Instead of focusing on what happens on the cutting board, we will deconstruct the supply chain itself. We will adopt the mindset of a supply chain analyst, treating your operation as a logistical network where every decision has a quantifiable financial impact. The goal is to re-engineer your processes to be so efficient that a 2% reduction in variance becomes an inevitable result, not a hopeful target. By mastering the tools and tactics of corporate logistics, you can transform hidden costs into tangible cash flow.
This article provides a systematic framework for analyzing and optimizing the critical logistical levers within your operation. We will examine vendor management, emergency sourcing, ordering cycles, and receiving protocols, providing data-driven strategies to minimize financial leakage at each stage.
Summary: A Mathematical Approach to Restaurant Supply Chain Efficiency
- Approved Vendors vs. Local Sourcing: When Is It Worth Asking for an Exception?
- What to Do When the Distribution Center Runs Out of Your Core Product?
- Weekly vs. Bi-Weekly Ordering: Which Cycle Frees Up More Cash Flow?
- The Receiving Mistake That Costs the Average Unit $500 a Month
- How to Piggyback on Corporate Rates for Utilities and Insurance?
- The Loading Dock Bottleneck: Scheduling Deliveries When You Have No Staff Yet
- Proprietary Supply Chain Tools vs. Open Market: Which Saves More Money?
- How to Set Up Your Opening Inventory Order Without Overbuying Perishables?
Approved Vendors vs. Local Sourcing: When Is It Worth Asking for an Exception?
Corporate-approved vendor lists are designed for consistency, purchasing power, and brand uniformity. Adherence is often non-negotiable. However, a purely rigid approach can overlook significant local opportunities for cost savings, quality improvement, or supply chain resilience. The analyst’s approach is not to break the rules, but to build a data-driven business case for a strategic exception. Blindly sourcing locally introduces risk, but a calculated exception, supported by evidence, can become a competitive advantage. The key is to quantify the trade-offs between brand consistency and operational benefits.
The process begins with data collection. Before proposing an alternative, you must have a clear baseline of your current approved vendor’s performance. This includes on-time delivery rates, order accuracy percentages, and the frequency of quality issues over a significant period, such as 90 days. Simultaneously, you must rigorously vet potential local suppliers not just on price, but on their ability to meet your quality standards, their insurance coverage, and their operational reliability. This isn’t about finding a cheaper price; it’s about finding a better landed cost and a more reliable partner.
A compelling case study in this area involves a national chain that successfully integrated local sourcing. By using supplier relationship management tools, they were able to negotiate better prices and more reliable deliveries for certain items without compromising core brand standards. They proved that with proper oversight and technology, local exceptions can enhance the supply chain. To make a similar case, you must present a risk assessment matrix that weighs the pros and cons objectively, alongside a cost comparison that includes not just the unit price but also delivery fees and projected spoilage rates. Proposing a limited, 60-day pilot program is often the most effective way to gain corporate approval, as it minimizes perceived risk while allowing the data to prove the concept.
What to Do When the Distribution Center Runs Out of Your Core Product?
A stockout of a core product at the primary distribution center (DC) is a critical failure point in any restaurant’s supply chain. It directly threatens revenue and customer satisfaction. In fact, supply chain issues are a pervasive problem; a recent analysis found that 77% of restaurant managers experienced disrupting delays in food supplies in 2023, forcing many to alter menus. The default reaction is often panic-buying from the nearest available source, leading to inflated costs and inconsistent quality. A strategic response, however, requires a pre-defined contingency plan that evaluates emergency sourcing options based on speed, cost impact, and quality risk.
The most efficient, yet often overlooked, solution is a peer-to-peer transfer from a nearby sister location. This maintains product consistency and can be executed the same day, though it incurs logistical costs. For chains, establishing a formal network for inter-store inventory sharing, visualized below, can turn isolated units into a resilient, self-supporting ecosystem. Other options, like using an approved retail supplier or a local wholesale club, offer speed but come with significant cost premiums (10-25%+) and potential quality variance. Sourcing directly from the manufacturer offers the best cost and quality but is the slowest option, making it unsuitable for immediate needs.

As the network diagram illustrates, creating connected supply lines between units transforms a potential crisis into a manageable logistical task. A formal decision-making matrix should be in place to guide managers during a stockout. This matrix should weigh the value of the out-of-stock item against the cost and risk of each sourcing alternative. The table below provides a clear framework for this analysis.
| Option | Speed | Cost Impact | Quality Risk |
|---|---|---|---|
| Peer-to-peer transfer | Same day | +5-10% | Low |
| Approved retail supplier | 1-2 days | +15-25% | Medium |
| Direct from manufacturer | 3-5 days | -5-10% | Low |
| Local wholesale club | Same day | +10-15% | Medium-High |
Weekly vs. Bi-Weekly Ordering: Which Cycle Frees Up More Cash Flow?
The frequency of inventory ordering is a powerful lever for managing cash flow, yet it’s often set by habit rather than strategic analysis. A bi-weekly cycle may seem efficient by reducing administrative time and meeting supplier delivery minimums, but it can tie up significant capital in standing inventory. Conversely, a weekly cycle increases cash flow velocity by lowering on-hand stock but can increase freight costs and the risk of stockouts. Neither approach is universally superior; the optimal strategy is a hybrid model based on a quantitative analysis of your inventory.
The first step is to categorize all inventory items using an ABC analysis. ‘A’ items are your high-velocity, high-cost products (e.g., prime proteins). ‘B’ items are mid-range in cost and velocity. ‘C’ items are your low-cost, shelf-stable goods (e.g., spices, dry goods). This classification allows you to tailor your ordering frequency. Shelf-stable ‘C’ items can be ordered bi-weekly or even monthly to hit delivery minimums and reduce administrative overhead. High-cost, perishable ‘A’ items, however, should almost always be on a more frequent weekly or even twice-weekly cycle to minimize spoilage risk and the amount of cash sitting on shelves.
The decision must also be informed by calculating your inventory carrying cost. This isn’t just the cost of the product; it’s a formula that includes the cost of capital, storage costs (rent, utilities), and the risk of spoilage or obsolescence. A simplified formula is: Carrying Cost = (Cost of Capital × 0.10) + (Storage Cost × 0.05) + (Spoilage Risk × 0.15). By applying this calculation, you might discover that the 15% you save on delivery fees for a large, bi-weekly order is completely negated by the carrying cost and spoilage risk of holding excess perishables for an extra week. This data-driven approach is why so many operators are investing in better systems.
Your Action Plan: Implementing a Hybrid Ordering Strategy
- Categorize all inventory items using ABC analysis based on velocity and cost.
- Set bi-weekly orders for shelf-stable ‘C’ items to meet minimum delivery requirements.
- Schedule weekly orders for high-velocity ‘A’ perishables and volatile-demand items.
- Calculate carrying cost using the formula: (Cost of Capital × 0.10) + (Storage Cost × 0.05) + (Spoilage Risk × 0.15).
- Review and adjust frequency monthly based on actual vs. theoretical variance data.
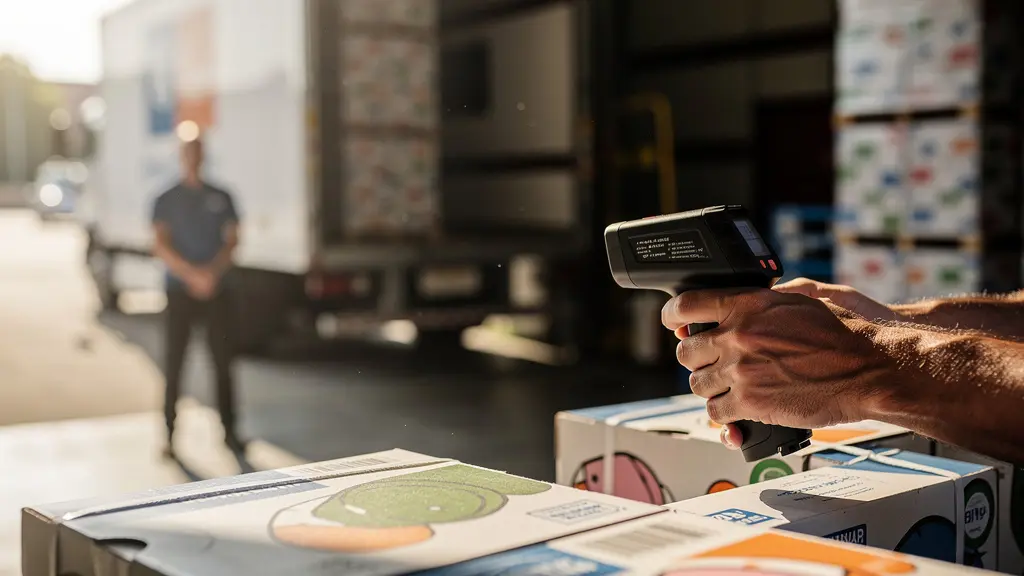
The Receiving Mistake That Costs the Average Unit $500 a Month
The single most significant point of “operational friction” in a restaurant’s supply chain is the loading dock. The most common and costly error is blind receiving: signing for a delivery without meticulously verifying its contents against the purchase order (PO). This seemingly small oversight—often rushed during a busy service—is a primary driver of food cost variance. It allows short-shipped items, incorrect products, and off-spec substitutions to enter your inventory, creating a discrepancy between what you paid for (actual cost) and what you can sell (theoretical value) from day one.
As the operations team at CrunchTime expertly points out, this has cascading consequences. The CrunchTime Operations Team notes in their “10 Tips to Reduce Food Costs Guide”:
An incorrect delivery that goes unnoticed can cause big problems, not just for tracking actual vs theoretical variance, but for making sure you don’t run out of something vital.
– CrunchTime Operations Team, 10 Tips to Reduce Food Costs Guide
The solution is to implement a rigid, non-negotiable receiving protocol. This includes a “No PO, No Signature” policy. Every line item on the invoice must be checked against the physical product received. For high-risk items like proteins and dairy, this process must include mandatory temperature checks to ensure the cold chain has not been broken. This is not just about catching errors; it’s about collecting data that holds vendors accountable.
Case Study: The True Cost of Blind Receiving
When restaurants systematically measure food cost variance, they gain insight into where inventory is slipping through the cracks. One multi-unit operator discovered that by implementing a strict “No PO, No Signature” policy and requiring temperature checks on all proteins upon delivery, they created a powerful feedback loop. A detailed analysis published by Marketman showed this simple procedural change reduced their monthly variance from 4.2% to 1.8%, saving approximately $520 per location each month by preventing mispriced or spoiled goods from ever entering their inventory.
How to Piggyback on Corporate Rates for Utilities and Insurance?
While food and labor costs receive the most attention, ancillary operating expenses like utilities, waste management, and insurance represent a significant, often unmanaged, cost center. For units within a larger corporate or franchise system, master agreements for these services are a hidden goldmine. Corporate procurement teams negotiate these contracts based on the collective volume of the entire system, securing rates that are impossible for a single location to obtain. However, many individual operators fail to fully leverage these agreements, either by being unaware of their full scope or by not ensuring local billing aligns with the contracted rates.
The first step is proactive discovery. An operator must request and review all current corporate master agreements on a quarterly basis. These documents often contain optional tiers, add-ons, or ancillary coverage options that are not automatically applied to each unit. For example, a master utility agreement might make a location eligible for specific local energy rebates that require a separate application. An insurance policy might include equipment breakdown coverage or cyber liability protection at a group rate that is far cheaper than sourcing it on the open market. Scheduling a call with the corporate procurement team to analyze your unit’s specific usage patterns can uncover這些 optimization opportunities.
The second, and equally critical, step is verification. It is common for local utility providers or insurance brokers to bill a location at standard rates, rather than the negotiated master rate. This is where corporate-provided software tools become invaluable. As one successful franchisee reported, running automated receiving reports through the system allows them to flag any discrepancies instantly. By comparing local charges against the contracted prices in the master agreement, they ensure they are always billed correctly. This vigilance pays off substantially.
By running automated receiving reports through corporate systems, franchise owners can keep an eye on vendor pricing and flag items outside of contracted prices, ensuring they’re being billed at the quoted corporate rate. One franchise owner reported saving $1,200 monthly by identifying billing discrepancies between local charges and master agreement rates.
– Franchise Owner, via Restaurant365
The Loading Dock Bottleneck: Scheduling Deliveries When You Have No Staff Yet
During the pre-opening phase, the loading dock transforms from a back-of-house area into the central nervous system of the entire operation. This is also a period when staffing is minimal, often limited to a few managers. Creating a delivery schedule that works for vendors without creating a bottleneck that overwhelms the skeletal crew is a critical logistical challenge. A poorly planned schedule results in chaos: perishable goods sitting on the dock in the heat, drivers waiting impatiently, and receiving duties being rushed, leading to the very errors we aim to prevent. The key is to create a tiered delivery schedule based on product type and the staffing required for proper check-in.
The foundational principle is to stagger deliveries throughout the day, matching the complexity of the order with available labor. Large, broadline deliveries from suppliers like Sysco or US Foods are the most labor-intensive, requiring at least two people to properly check-in, verify, and put away the entire order. These should be scheduled for a very early window (e.g., 5:00-7:00 AM) when the management team is fresh and can dedicate their full attention to the task. These deliveries are almost never eligible for a “key drop” (unattended delivery) due to their value and complexity.
Subsequent deliveries should be scheduled in descending order of priority and labor requirement. Fresh produce and dairy, which require temperature checks and careful handling, can be scheduled for a mid-morning slot (7:00-9:00 AM) and can typically be handled by a single, focused manager. Less critical and non-perishable items like bread, paper goods, and linen can be scheduled for later in the day. Many of these vendors offer key drop options, allowing deliveries to be made without any staff present, which frees up valuable management time for other pre-opening tasks. A structured delivery window schedule is not a suggestion; it’s an essential tool for a smooth opening.
| Delivery Type | Optimal Window | Staff Required | Key Drop Option |
|---|---|---|---|
| Broadline (Sysco/US Foods) | 5:00-7:00 AM | 2 staff | No |
| Produce/Dairy | 7:00-9:00 AM | 1 staff | No |
| Bread/Bakery | 9:00-11:00 AM | 1 staff | Sometimes |
| Linen/Paper Goods | Anytime | 0 staff | Yes |
Key Takeaways
- Food cost variance is primarily a logistical problem, not a culinary one. The biggest gains come from optimizing processes before ingredients reach the kitchen.
- Every supply chain decision has a quantifiable impact. Use metrics like landed cost, cash flow velocity, and carrying cost to guide your strategy.
- Rigid, non-negotiable receiving protocols are the single most effective tool for closing the gap between actual and theoretical food costs.
Proprietary Supply Chain Tools vs. Open Market: Which Saves More Money?
In the quest to reduce variance, technology is a powerful ally. Operators are often faced with a choice: use the all-in-one, proprietary supply chain software provided by their corporate parent, or piece together a “best-in-class” solution from open market vendors. The proprietary system offers seamless integration and standardized reporting, but can come with mandatory supplier agreements that limit purchasing flexibility. Open market tools may offer more advanced features or better pricing for specific tasks, but can create data silos and integration headaches. The correct choice is not based on features, but on a rigorous Total Cost of Ownership (TCO) analysis.
TCO looks beyond the monthly subscription fee. It forces you to quantify all associated costs. For a proprietary system, this includes potential “vendor lock-in” costs—the premium you might pay for being forced to use a specific supplier who is integrated with the software. For open market tools, TCO includes direct costs (subscription, setup fees) as well as indirect costs, such as the labor hours required for manual data migration, API connections, and training. A cheaper subscription can quickly become more expensive when you factor in 20 hours of a manager’s time spent wrestling with spreadsheets.
The ultimate deciding factor should be the system’s ability to provide actionable analytics, specifically the calculation of actual vs. theoretical variance. A system that cannot do this effectively is merely a digital ordering catalogue, not a strategic management tool. The framework for a TCO analysis should include:
- Direct Costs: Subscription fees, setup, and training hours.
- Integration Costs: Hours needed for data migration and API connections.
- Opportunity Costs: Vendor lock-in premiums vs. open market rates.
- Efficiency Gains: Quantified time saved on ordering, reporting, and variance tracking.
This mathematical approach ensures the chosen technology solution genuinely reduces costs rather than simply shifting them from one line item to another.
How to Set Up Your Opening Inventory Order Without Overbuying Perishables?
Placing the initial inventory order for a new restaurant is one of the most high-stakes logistical decisions in the pre-opening process. Overbuying ties up critical opening capital and leads to massive spoilage, while underbuying results in stockouts and a disastrous opening week. The common mistake is to order based on projected sales. As one restaurant opening consultant wisely notes, this ignores a crucial variable.
Your first week’s product usage won’t be from sales; it will be from staff training, recipe testing, and inevitable mistakes.
– Restaurant Opening Consultant, Pre-Opening Inventory Management Guide
A data-driven approach requires a three-phase ordering strategy tied to shelf life, alongside a separate, calculated budget for training and waste. This method de-risks the process and preserves cash. You must create a projected PAR level (Periodic Automatic Replacement) for every item based on sales forecasts, but you do not order to 100% of PAR for everything at once. The key is to stagger the orders based on perishability, minimizing the time high-cost, short-shelf-life items spend on your shelves before opening day.
The strategy unfolds as follows:
- Phase 1 (7 days out): Order all non-perishables (dry goods, canned items, spices, paper goods) at 100% of your projected PAR levels. These items are stable and their early arrival helps with initial storeroom organization.
- Phase 2 (3 days out): Order semi-perishables like hard produce (onions, potatoes), some cheeses, and cured meats. Order these at only 75% of your projected PAR to hedge against forecasting errors.
- Phase 3 (1 day out): Place your order for high-cost, highly perishable items like fresh fish, delicate greens, and fresh dairy. This order should be at a conservative 50% of PAR, with a pre-arranged backup supplier on standby for day-of adjustments.
In parallel, calculate a training waste budget (e.g., Number of staff × 3 dishes per person × ingredient cost) to account for product used in training, ensuring it doesn’t distort your opening food cost figures.
To translate these principles into profit, the next logical step is to conduct a full audit of your current supply chain processes, from vendor contracts to receiving protocols. Applying this analytical rigor is how you move from managing costs to actively engineering profit.