The most profitable retail location is not the one with the highest visibility or the lowest rent; it’s the site with the optimal Traffic-per-Dollar Ratio, a metric that balances cost against quantifiable revenue drivers.
- Physical barriers like left-turn restrictions can reduce revenue from a significant portion of traffic, creating “access friction” that must be factored into your financial model.
- Co-locating with an anchor tenant like a grocery store provides a consistent, high-frequency stream of foot traffic that standalone locations must pay to generate through advertising.
Recommendation: Move beyond base rent. Calculate the “invisible” costs (like HVAC age and zoning risks) and weigh the rent premium for a high-visibility spot against your projected ad spend savings to reveal the true cost of each location.
For any retail investor, the choice between a high-visibility corner lot and a space within a bustling strip mall presents a fundamental dilemma. The conventional wisdom champions “location, location, location,” often interpreted as securing the most prominent spot money can buy. This leads many to over-index on raw visibility, assuming that a higher rent for a corner property will automatically translate to higher profits. Others, wary of steep rental costs, gravitate towards the seemingly safer, more affordable option of a strip mall, hoping to benefit from a built-in ecosystem of shoppers.
The problem with both approaches is that they are based on assumptions rather than a rigorous, data-driven framework. The debate shouldn’t be about “high rent vs. low rent” or “visible vs. hidden.” The real key to a profitable site selection lies in a more sophisticated analysis that goes beyond the obvious. It involves dissecting the micro-geography of traffic patterns, understanding the symbiotic relationship with anchor tenants, and uncovering the hidden operational costs that can erode a location’s profitability.
But what if the true measure of a location’s value wasn’t its address, but its calculated Traffic-per-Dollar Ratio? This article abandons generic advice to provide a retail site selector’s analytical framework. We will break down the critical, often-overlooked variables that determine a location’s true potential. You will learn how to quantify factors like left-turn access, the magnetic pull of anchor tenants, the financial time-bombs hidden in a building’s infrastructure, and the demographic viability of your concept for a given market. This guide provides the tools to transform your site selection from a high-stakes gamble into a calculated investment.
This comprehensive analysis will walk you through the essential due diligence steps, from the road to the roof. By examining these eight critical facets of site selection, you will be equipped to make a data-backed decision that maximizes your return on every rental dollar spent.
Summary: A Data-Driven Framework for Retail Site Selection
- Left-Turn Access: Why Being on the “Going Home” Side of the Road Matters?
- Anchors and Magnets: How Being Near a Grocery Store Boosts Your Sales?
- How to Prevent the Landlord from Renting to a Competitor Next Door?
- HVAC and Roof age: Inspecting the “Bones” of the Building Before Signing
- Zoning Nightmares: How to Verify if Your Concept Is Actually Allowed on This Street?
- The Niche Trap: Why Specialized Concepts Fail in Towns Under 50,000 People
- How to Map Competitors and Cannibalization Risks in a 5-Mile Radius?
- Why Paying 20% More Rent for High Visibility Saves You 50% in Ad Spend?
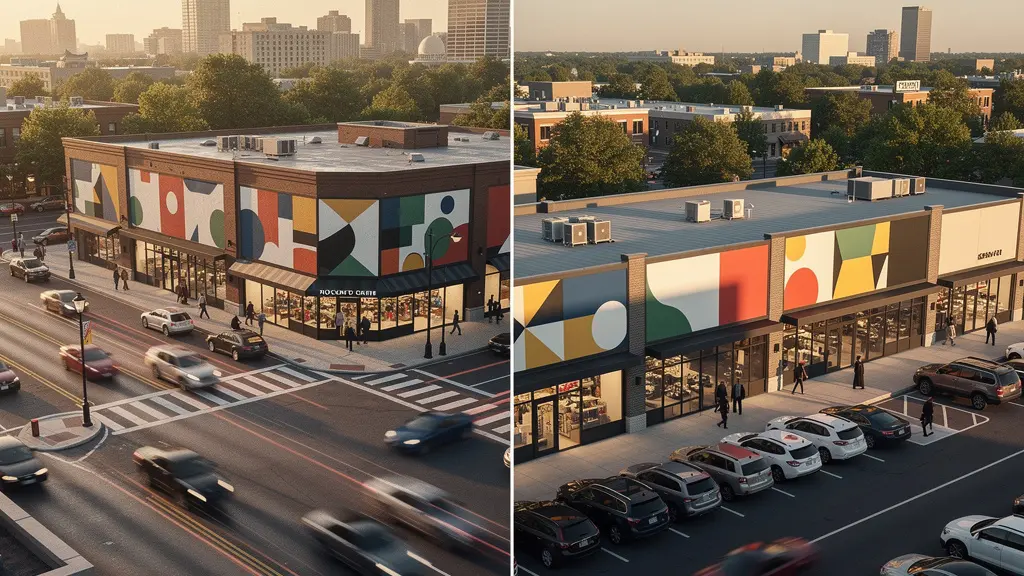
Left-Turn Access: Why Being on the “Going Home” Side of the Road Matters?
Before analyzing the building or its neighbors, the first analysis must happen at the curb. A location’s accessibility is not binary; it’s a spectrum defined by what site selectors call “ingress and egress.” One of the most significant factors is the left-turn access. A property located on the “going home” side of a major commuter road—typically the right-hand side for evening traffic—captures customers at their most convenient moment. Conversely, a location requiring a left turn across multiple lanes of traffic, especially without a dedicated turn lane or signal, creates significant access friction. This friction acts as a powerful deterrent, effectively cutting you off from a large portion of the potential customer base driving by.
This isn’t a minor inconvenience; it’s a quantifiable revenue killer. Customers value ease and speed, and forcing them to navigate a difficult U-turn or wait through several light cycles to enter your parking lot is a direct tax on their time. As a result, many will simply continue to a more accessible competitor. A case study comparing two shopping centers on the same road starkly illustrates this point. The property with a solid median preventing left turns had demonstrably lower performance than the one with dedicated turn lanes, a direct consequence of superior access design. The perceived value of being on a “busy street” is nullified if half that traffic cannot easily reach you.
Therefore, a core part of your due diligence is to physically observe traffic patterns during peak hours (morning and evening commutes). Is your potential site on the “going to work” side or the “going home” side? How many potential customers would need to make a difficult or prohibited left turn to reach you? Quantifying this “left-turn penalty”—which can represent a 15-25% reduction in capture rate from that segment of traffic—is essential. This potential revenue loss must be weighed against any rent savings the “less convenient” side of the street may offer. Often, a slightly higher rent on the easily accessible side provides a far better return on investment.
Anchors and Magnets: How Being Near a Grocery Store Boosts Your Sales?
An anchor tenant is a large, well-known retailer that serves as the primary draw for a shopping center. Their powerful brand recognition and essential service offerings generate a consistent and predictable stream of foot traffic for the entire property. While department stores once dominated this role, today’s most powerful anchors are grocery stores. According to recent industry analysis, out of all anchor tenants, 60% are grocery stores, making them the primary footfall generators for modern shopping centers. This isn’t just incidental traffic; it’s high-frequency, needs-based traffic.
The strategic advantage of co-locating with a grocery anchor is immense. These stores attract customers for non-discretionary, recurring purchases, creating a reliable flow of potential patrons for your business. Think of the customer who stops for groceries twice a week; each visit is an opportunity for them to also visit your coffee shop, dry cleaner, or boutique. This symbiotic relationship provides smaller tenants with a steady marketing impression channel that a standalone location would have to pay dearly to replicate through advertising. The grocery store effectively subsidizes your customer acquisition efforts.
The visual below illustrates the customer flow in a typical grocery-anchored center, showing how traffic naturally disperses from the main anchor to the surrounding smaller retail spaces. This pattern highlights the shared benefit of the anchor’s magnetic pull.
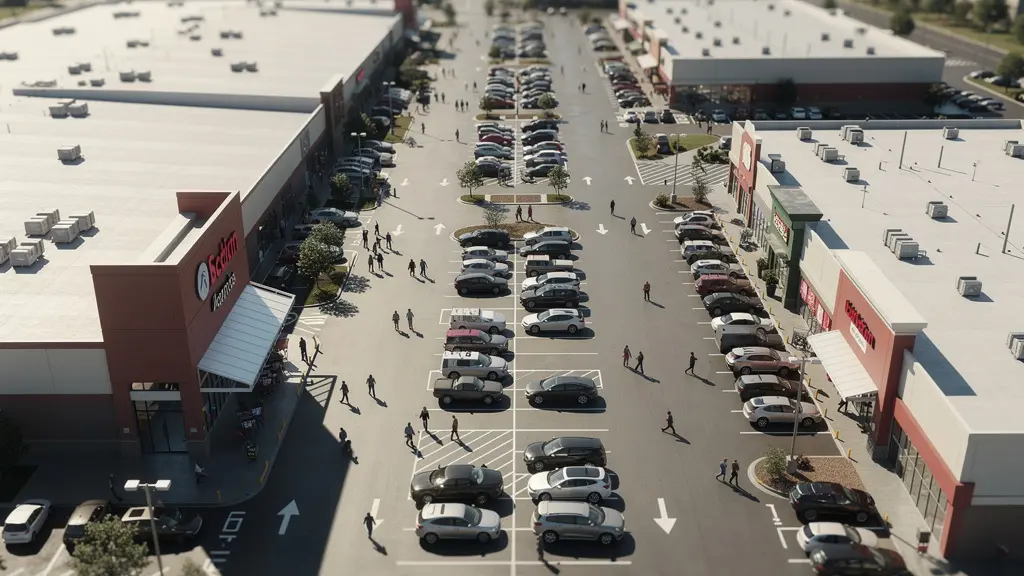
This powerful effect is reflected in the operational metrics of anchored centers versus unanchored ones. As the data shows, the presence of a strong anchor tenant has a profound positive correlation with occupancy rates, overall foot traffic, and customer visit frequency. The anchor isn’t just another tenant; it’s the economic engine of the entire center.
The following table, based on established commercial real estate principles, quantifies the dramatic difference an anchor tenant makes on a shopping center’s performance. As noted in an analysis of retail center dynamics, the impact is undeniable.
| Metric | With Anchor Tenant | Without Anchor Tenant |
|---|---|---|
| Occupancy Rate | 95%+ typical | Variable, often lower |
| Foot Traffic | Consistently outperforms centers without anchors | Lower overall visitation |
| Space Allocation | 50-70% of leasable space to anchors | 100% to smaller tenants |
| Customer Frequency | 1.6 trips per week average for grocery anchors | Less frequent visits |
How to Prevent the Landlord from Renting to a Competitor Next Door?
Securing a spot in a thriving, well-anchored strip mall is a significant achievement. However, that success can be quickly undermined if the landlord rents an adjacent space to a direct competitor. Suddenly, the ecosystem you paid to join becomes a battleground, cannibalizing your customer base and eroding your margins. Protecting your investment requires proactive negotiation before the lease is signed, specifically through a well-crafted exclusivity clause. This is not a standard “boilerplate” item; it is a critical business-protection tool that you must demand and define with precision.
A generic clause stating “no other coffee shops” is insufficient. What if a bakery opens next door and starts selling high-end espresso drinks that account for 30% of their revenue? Your clause must be specific. Define competition not just by business type but by product or service category, ideally tied to a revenue percentage (e.g., “no tenant deriving more than 10% of its gross sales from the sale of espresso-based beverages”). Furthermore, you should negotiate the radius of this protection, ensuring it extends to other properties the landlord may own within a 1-to-3-mile radius to prevent them from simply placing a competitor in their next-closest center.
As one expert notes, this is a standard and expected part of commercial negotiation. As Cliff Hockley points out in the Stratafolio Commercial Real Estate Guide:
Regional and national tenants will ask for exclusive use clauses. A convenience store might make it almost impossible to bring in additional tenants with their extensive list of exclusions.
– Cliff Hockley, Stratafolio Commercial Real Estate Guide
The clause must also have teeth. A breach of exclusivity should trigger significant, pre-defined penalties. These can include an automatic 50% rent reduction for the duration of the breach and, most importantly, the unconditional right for you to terminate the lease without penalty. This gives you leverage and an escape hatch if the landlord fails to uphold their end of the bargain. Your goal is to make it more costly for the landlord to violate the clause than to honor it.
Your Action Plan: Auditing and Fortifying Your Exclusivity Clause
- Points of contact: Define the ‘competitive universe’ by listing all specific product/service categories (e.g., “espresso beverages,” “panini-style sandwiches”) where a new tenant could create overlap.
- Collecte: Inventory the landlord’s standard lease agreement and any existing tenant exclusivity clauses within the center to understand the current competitive landscape and precedent.
- Cohérence: Confront the drafted ‘competitor’ definition with your core business model. Ensure it protects your primary revenue streams without being so broad that the landlord rejects it outright.
- Mémorabilité/émotion: Pinpoint the unique enforcement ‘teeth’ of the clause. The strength lies not in the restriction itself, but in the automatic penalties for a breach (e.g., 50% rent reduction, lease termination rights).
- Plan d’intégration: Establish a priority plan for negotiation. Identify which elements of the clause are “must-haves” versus “nice-to-haves” to guide your discussions with the landlord.
HVAC and Roof age: Inspecting the “Bones” of the Building Before Signing
An attractive base rent can easily mask a multitude of expensive problems hiding within the building’s infrastructure. As an investor, your analysis cannot stop at the square footage and location; you must investigate the “bones” of the property, primarily the Heating, Ventilation, and Air Conditioning (HVAC) system and the roof. These are two of the largest potential capital expenditures in a commercial property, and their age and condition can have a staggering impact on your Total Cost of Ownership (TCO). A 15-year-old HVAC unit on its last legs is a financial time bomb waiting to detonate, potentially costing you tens of thousands in replacement costs and lost business during downtime.
Before signing a lease, it is imperative to commission a professional inspection of these systems. Your lease negotiation should clarify exactly who is responsible for maintenance, repair, and eventual replacement. In many triple net (NNN) leases, these costs fall directly on the tenant. Therefore, a property with a brand-new HVAC system and roof is inherently more valuable and carries less financial risk than one with aging infrastructure, even if the base rent is slightly higher. The efficiency of the HVAC system also directly affects your monthly utility bills. An older, less efficient unit can lead to significantly higher operating costs, an “invisible rent” that doesn’t appear on the lease agreement.
A comprehensive TCO model should move beyond base rent to include these variables. For instance, a property offered at $20/sq ft with a 15-year-old HVAC might seem like a bargain compared to a similar space at $22/sq ft with a new system. However, once you factor in the higher monthly utility costs and the amortized cost of an imminent replacement, the “cheaper” option could effectively cost you over $25/sq ft over the lease term. This analytical approach transforms a rent comparison into a true cost-benefit analysis.
The table below outlines the general financial impact of aging building systems. It demonstrates how efficiency loss translates directly into increased monthly costs and brings the need for capital-intensive replacement closer.
| System Age | HVAC Efficiency Loss | Estimated Monthly Cost Increase | Replacement Timeline |
|---|---|---|---|
| 0-5 years | 0-5% | Baseline | 10-15 years |
| 5-10 years | 10-15% | +$200-400 | 5-10 years |
| 10-15 years | 20-30% | +$500-800 | 1-5 years |
| 15+ years | 35-50% | +$1000+ | Immediate consideration |
Zoning Nightmares: How to Verify if Your Concept Is Actually Allowed on This Street?
You’ve found the perfect location: great visibility, strong anchor, and a brand-new HVAC system. You sign the lease, begin your build-out, and then receive a stop-work order from the city. Your specific business concept—a microbrewery, a cloud kitchen, a fitness studio with late hours—is not a permitted use for that specific zoning district. This is a zoning nightmare, and it’s a completely avoidable disaster. A lease agreement does not override municipal law. Assuming your business is allowed simply because a space is available for rent is one of the most catastrophic errors an investor can make.
Zoning ordinances are complex local laws that dictate exactly what types of commercial activities can operate in specific areas. A street may be zoned for “general retail” but have specific prohibitions against businesses that serve alcohol, generate specific levels of noise, or require special ventilation. Furthermore, a property might be subject to Covenants, Conditions & Restrictions (CC&Rs), which are private rules set by the property developer or homeowners’ association that can be even more restrictive than city zoning. For example, a CC&R might prohibit any food service operations in a certain part of a mixed-use development.
The due diligence process for zoning must be exhaustive. It begins with reviewing the city’s official zoning maps and ordinances to confirm the property’s designation and the list of permitted uses. However, you cannot stop there. The next step is to schedule a pre-application meeting with the city planning department. In this meeting, you present your specific business concept and site plan and ask them to confirm in writing that it is a permitted use. This creates a paper trail and provides a level of assurance that a simple map review cannot. As urban planning evolves, trends like mixed-use retail in suburban areas are becoming more common, which can sometimes lead to more complex or recently changed zoning codes.
Crucially, your lease agreement must contain a permit contingency clause. This clause states that the lease is null and void if you are unable to obtain all necessary permits and licenses to operate your business as intended within a specified timeframe. Without this clause, you could be legally obligated to pay rent on a space you can never legally occupy. Verifying zoning isn’t a formality; it’s a foundational pillar of site selection that protects your entire investment from being invalidated by a bureaucratic technicality.
The Niche Trap: Why Specialized Concepts Fail in Towns Under 50,000 People
A brilliant, highly specialized retail concept can thrive in a dense urban center but quickly fail in a smaller market, even with a prime location. This is the “niche trap.” The success of a specialized business—like a vegan restaurant, a high-end cycling shop, or a store dedicated to rare board games—is directly dependent on reaching a minimum viable population. You are not just targeting the total population of a town; you are targeting the tiny fraction of that population that constitutes your niche audience. In smaller markets, that fraction may simply not be large enough to sustain a business.
Before ever evaluating a specific site, you must perform a macro-level demographic analysis of the entire trade area. Start by defining your target customer profile with extreme precision. Then, use demographic data to estimate what percentage of the local population fits this profile. If your vegan restaurant targets a demographic that represents 3% of the population, a town of 30,000 people offers a total potential customer base of only 900 individuals. To be viable, you would need to achieve an unrealistically high capture rate of this small group. The same great concept in a metropolitan area of 1,000,000 people has a potential base of 30,000 customers, a far more sustainable proposition.
This analysis requires a brutally honest assessment of your concept’s appeal. While services with broad appeal like dentists, hair salons, and coffee shops can succeed almost anywhere, niche concepts require a critical mass of potential customers. The table below provides a general framework for estimating the minimum population needed to support various types of specialized retail concepts, highlighting the relationship between the target demographic’s size and the necessary market scale.
| Concept Type | Target Demo % | Min. Population Needed | Capture Rate Required |
|---|---|---|---|
| Vegan Restaurant | 3-5% | 75,000-100,000 | 30-40% |
| Specialty Coffee | 15-20% | 25,000-35,000 | 20-25% |
| Ethnic Cuisine | 8-12% | 40,000-60,000 | 25-30% |
| Premium Fitness | 10-15% | 35,000-50,000 | 15-20% |
Ignoring this demographic threshold is a recipe for failure. No amount of visibility or cheap rent can compensate for a market that is fundamentally too small to support your business model. The first question in site selection is not “where is the best corner?” but “is this the right town?”
How to Map Competitors and Cannibalization Risks in a 5-Mile Radius?
Once you’ve validated the market size, the next layer of analysis is a granular mapping of the competitive landscape. This goes beyond simply identifying direct competitors; it involves understanding their density, performance, and the potential for customer cannibalization. A 5-mile radius is a standard benchmark for this trade area analysis. The goal is to create a visual map that plots your potential location along with every existing competitor, allowing you to identify clusters, gaps, and areas of over-saturation. This process reveals the true competitive pressure on your proposed site.
The strength of the strip center market, driven by consumer preference for convenience, has made these locations highly desirable. In fact, data shows the market is tighter than ever; the rate of available space in strip centers fell to 5.3% in 2023, the lowest level on record. This high demand means you must be even more strategic about where you place your pin on the map. Entering a trade area with three existing, successful competitors means you are not fighting for new customers, but rather trying to steal market share from established players—a far more expensive and difficult proposition.
Your analysis should also consider indirect competitors and future risks. For example, if you are opening a quick-service lunch spot, you are competing not only with other sandwich shops but also with the deli counter at the nearby grocery store and the drive-thru of a fast-food chain. A comprehensive study on post-pandemic retail trends showed that annual visits to strip centers increased 18%, largely because consumers prefer quick, convenient trips. Your competitive map must reflect this reality by including all options a customer might consider for a similar need. Furthermore, you must research any new construction or announced projects in the area. A competing development opening six months after you could drastically alter the landscape and undermine your projections.
This mapping exercise is not just about avoiding competition; it’s about finding the sweet spot. An ideal location might be one that is accessible to a large residential population but is currently underserved in your specific category. The map helps you identify these pockets of opportunity that a simple drive-by would miss. It quantifies the risk, highlights opportunity, and provides a strategic foundation for your revenue projections.
Key Takeaways
- Location value is not just rent; it’s a function of quantifiable factors like traffic access, anchor tenant synergy, and hidden operational costs (TCO).
- Micro-geographical details, such as being on the “going home” side of the road, can have a disproportionate impact on revenue by reducing “access friction.”
- Before considering a site, you must verify that the market’s demographic size can support your niche and that the local zoning laws permit your specific business concept.
Why Paying 20% More Rent for High Visibility Saves You 50% in Ad Spend?
We now return to the original dilemma: the expensive, high-visibility corner lot versus the more affordable strip mall space. Armed with a full analytical framework, we can finally answer this question not with intuition, but with a calculation. The higher rent for a prime corner location is not just a cost; it is, in effect, a marketing expense. The thousands of cars and pedestrians that pass by your storefront each day represent a massive number of impressions. The key is to determine if this “rent-as-marketing” is more cost-effective than traditional advertising.
The calculation is straightforward. First, determine the monthly rent premium for the high-visibility location in dollars (e.g., 20% more than the strip mall alternative). Next, estimate the monthly traffic impressions the location receives using official traffic count data. By dividing the rent premium by the number of impressions, you can calculate a “Location CPM” (Cost Per Mille, or cost per thousand impressions). You can then compare this Location CPM directly to the CPM rates of other marketing channels like social media ads, search engine marketing, or local radio. In many cases, you will find that the Location CPM is significantly lower, meaning you are getting more brand exposure for your dollar through the physical location than you would through a digital ad campaign.
This high visibility also creates a powerful flywheel effect. A prominent location with strong branding acts as a 24/7 billboard, building top-of-mind awareness. This leads to an increase in branded search volume online and higher engagement with your Google Business Profile, amplifying the effectiveness of your digital marketing efforts. In essence, the physical visibility and digital presence begin to reinforce each other. The money “saved” on a cheaper, hidden location is often immediately re-spent on a larger advertising budget simply to achieve the baseline awareness the visible location provides for free.

Of course, this calculation is only valid if all other factors are equal. A high-visibility location with terrible access, no parking, or an aging HVAC system may not be a wise investment. However, when comparing two otherwise solid options, quantifying the marketing value of visibility is the final step. It allows you to see the rent premium not as a liability, but as a strategic investment in customer acquisition. The decision becomes a simple matter of choosing the most efficient allocation of your capital—is it better spent on rent or on ads?
Ultimately, selecting the most profitable retail site is a science of diligent, multi-layered analysis. By moving beyond surface-level metrics like base rent and applying this quantitative framework, you replace guesswork with a data-backed strategy. Evaluate each potential location through this critical lens to ensure your next investment is built on a foundation of profitability and long-term success. Begin today by applying this analytical rigor to your site selection process.